Runes launched on April 20, the day of Bitcoin’s fourth halving. Fueled by the hype surrounding the much-anticipated halving, they were introduced to the market with a bang, garnering an incredible amount of attention and activity.
Their launch caused quite a stir in the crypto industry, especially in the Bitcoin market, where it sparked a fierce debate on Bitcoin’s future and utility, not unlike the one we saw with the launch of Bitcoin Ordinals.
It’s now been a month since Runes launched — a long enough period that enables us to get a solid understanding of how they affected the market and allows us to make some predictions about their future.
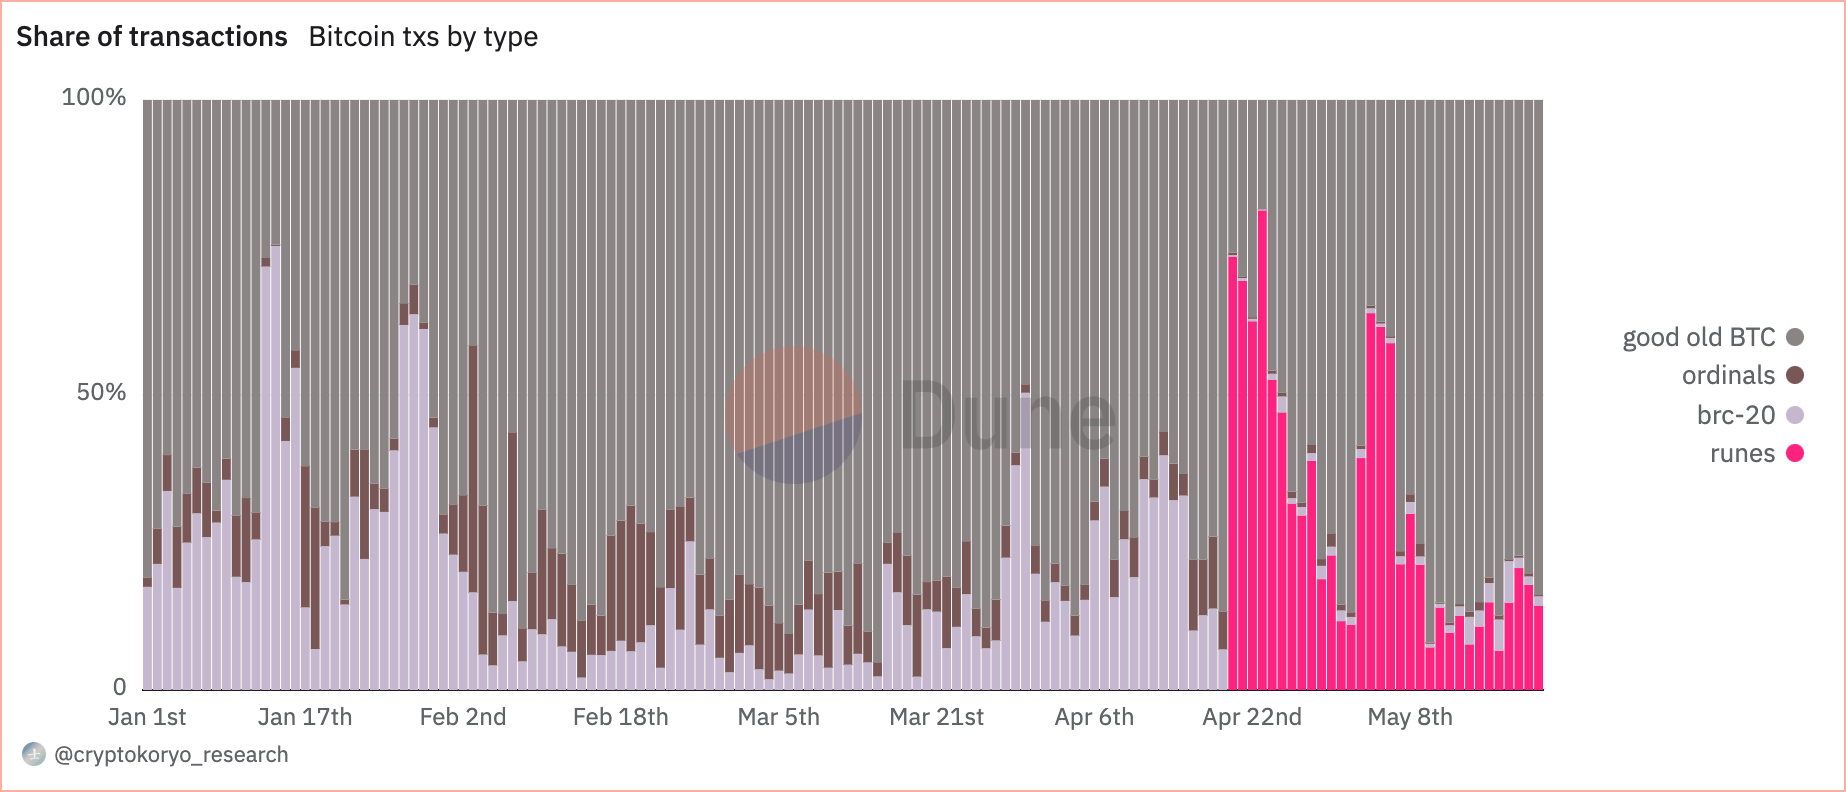
CryptoSlate’s initial analysis showed that Runes’s initial impact on the market was substantial. On the day of the halving, Runes transactions made up 57.7% of all Bitcoin transactions that day, compared to just 0.5% for Ordinals and 0.2% for BRC-20 tokens.
While this sudden dominance reflected the massive interest in Runes, it was evident that such a sharp spike in the share of transactions was unsustainable in the long run.

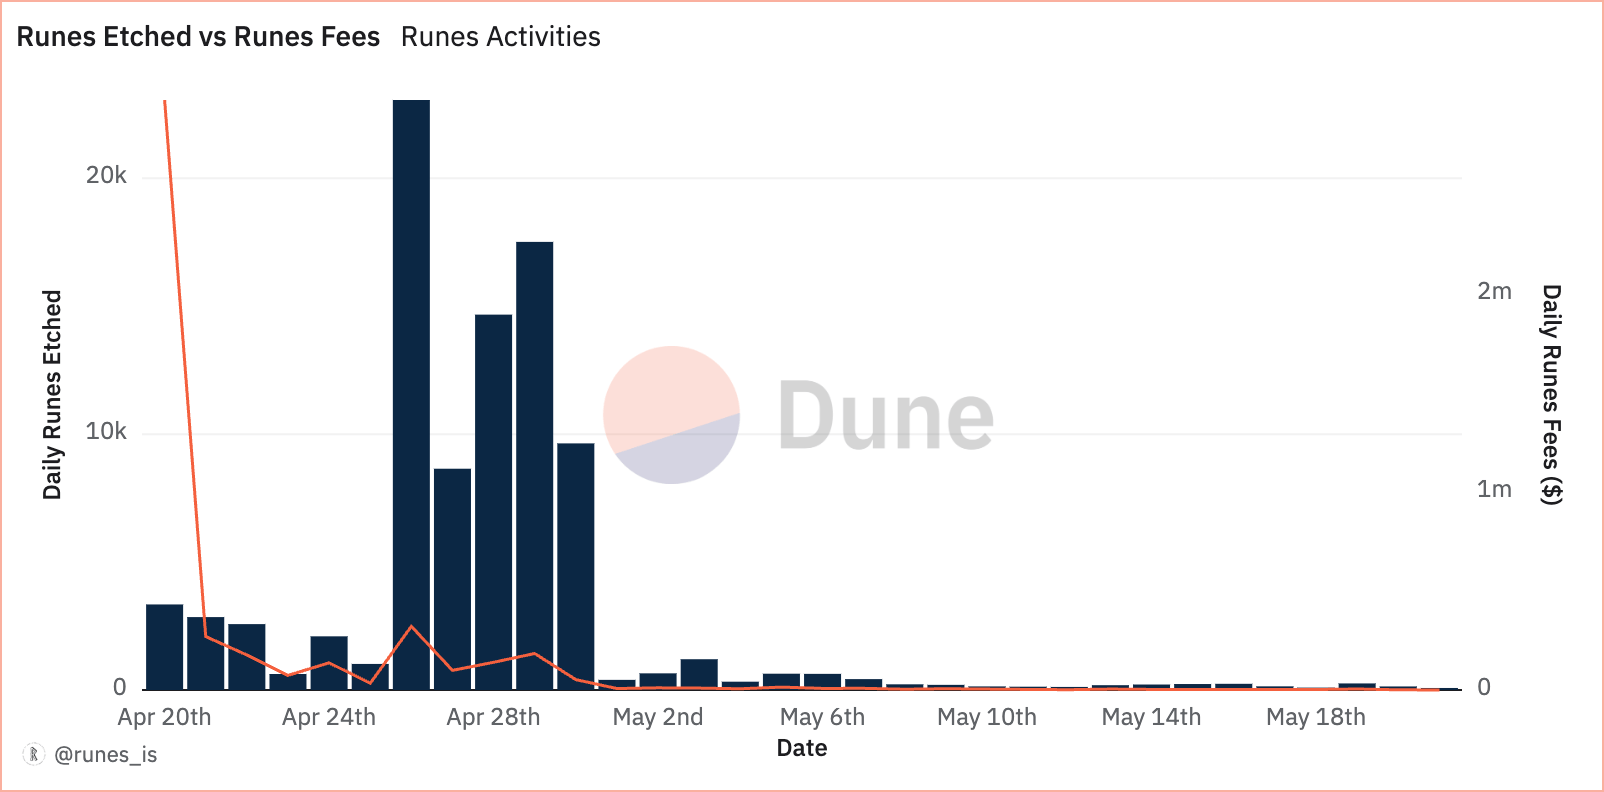
Daily data from Dune Analytics showed a fluctuating pattern in Runes activity in the days following the launch. On April 20, 3,344 Runes were etched, generating $2.997 million in fees. This high activity level was short-lived, with a sharp decline observed in the following days.
By April 23, only 625 Runes were etched, with fees dropping to $73,793. The peak occurred on April 26, with 23,061 Runes etched, but this momentum did not sustain, with figures dropping to 139 Runes by May 20.

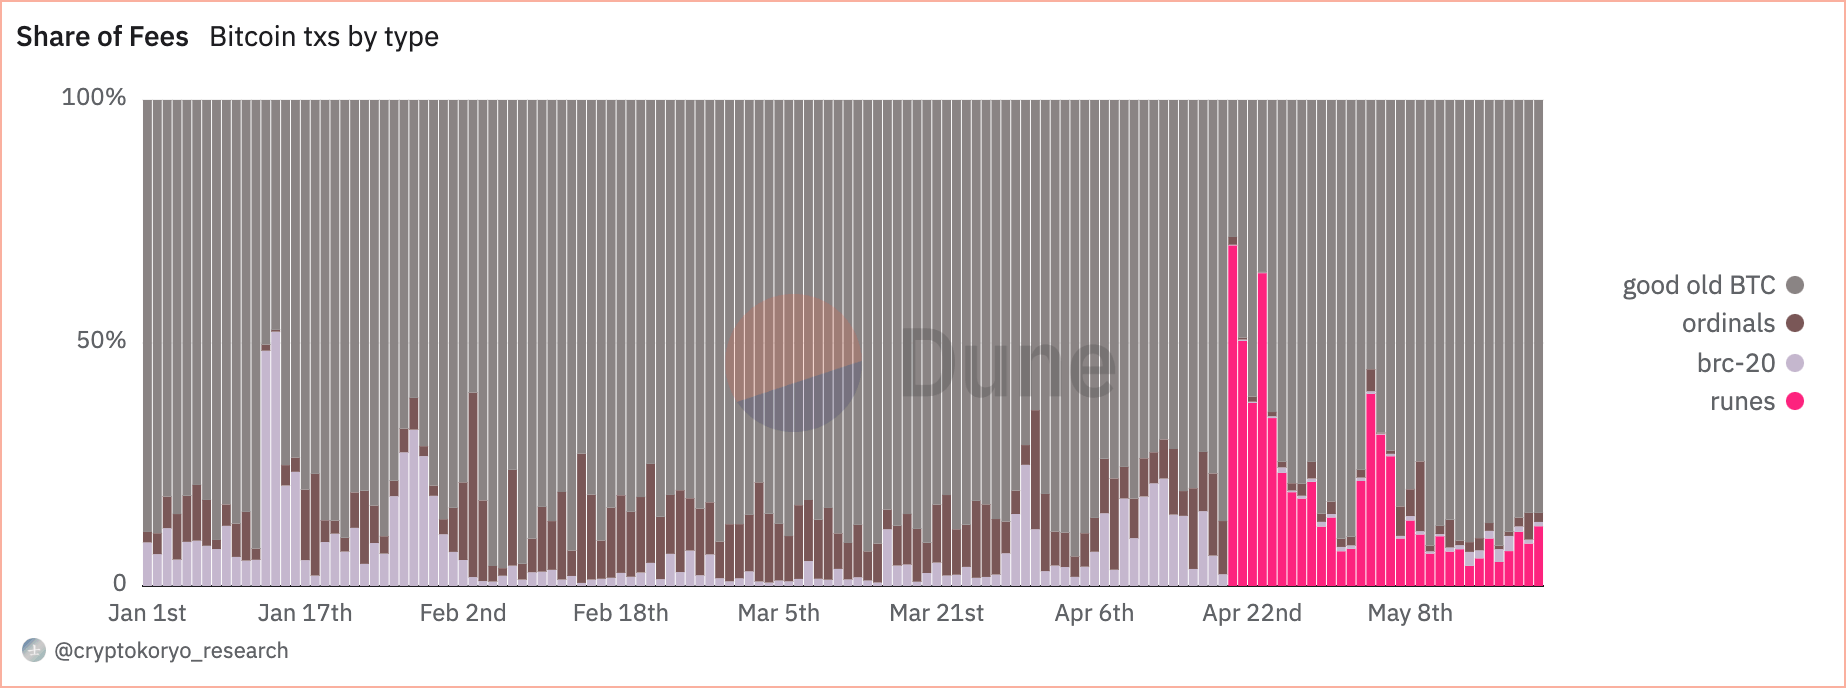
The share of Runes in total Bitcoin fees was also unsustainable. On April 20, they accounted for 70.1% of fees. These figures fluctuated significantly over the month, with transaction shares reaching 81.3% on April 23 and fees hitting 64.4%. By May 20, Runes transactions constituted 17.8% of the total, and fees dropped to 8.7%.

Despite the drastic decline in popularity and usage, Runes still managed to leave quite a mark in the Bitcoin market. In their first 30 days, a total of 92,713 Runes were created through 7.150 million transactions, with mint transactions accounting for 3.861 million of these.
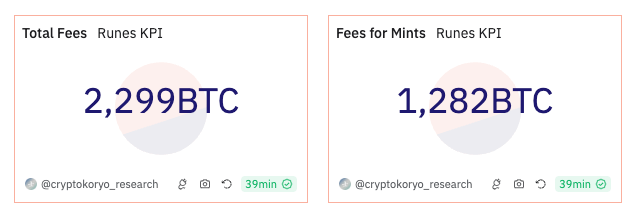
All of this activity generated a significant amount of transaction fees, totaling 2,299 BTC, with 1,282 BTC derived from mint transactions alone.

The data suggests that Runes are settling into a more stable, albeit less dominant, role within the Bitcoin ecosystem. This pattern mirrors that of Ordinals, which faced similar initial enthusiasm that was followed by stabilization.
As Runes become a more permanent fixture in the Bitcoin market, their influence on fees and transactions is expected to reduce significantly. Even just a month after their launch, the initial surge of activity and fees has tapered off, leading to a more stable and predictable integration into the Bitcoin transaction landscape. While we can expect a short-lived spike in activity during popular mints, this stability is likely to continue in the coming months.
The post 30 days of Runes: Interest fizzles after spectacular launch appeared first on CryptoSlate.

